States by Fraction of the US Population
d.w.rowlands [at] gmail.com
While it's well-known to modern Americans which states have relatively larger or smaller populations. However, the relative sizes of states have changed a lot over the past two centuries, both because of changes in population density and because of the addition of new states beyond the original thirteen. These changes, furthermore, are still happening. For example, New York lost two electoral votes in the 2010 census, and Florida gained two electoral votes, which means that they're now tied for third-most electoral votes, after California and Texas. Furthermore, given current population trends, Florida seems likely to overtake New York in the next census. The continued slide of New York behind sunbelt states is notable given that, starting with the 1810 census, New York had had the most electoral votes of any state for about a century and a half.
Adding to my interest on the matter, I recently read a book called Dred Scott and the Problem of Constitutional Evil, by Mark A. Graber that discussed at length the fact that the Framers nearly universally expected that the South would quickly greatly surpass the North in population, because they felt the Northern colonies were "full", while the Southern ones had large amounts of empty land, and they believed that the Northwest Territory (the modern states of Ohio, Indiana, Illinois, Michigan, Wisconsin, and part of Minnesota) was largely not worth cultivating, while the lands south of the Ohio would attract a large population. It turned out that they were wrong, especially since European immigrants flooded into the country and almost entirely preferred to settle in free, Northern states, which upset Constitutional provisions intended to protect a Northern minority.
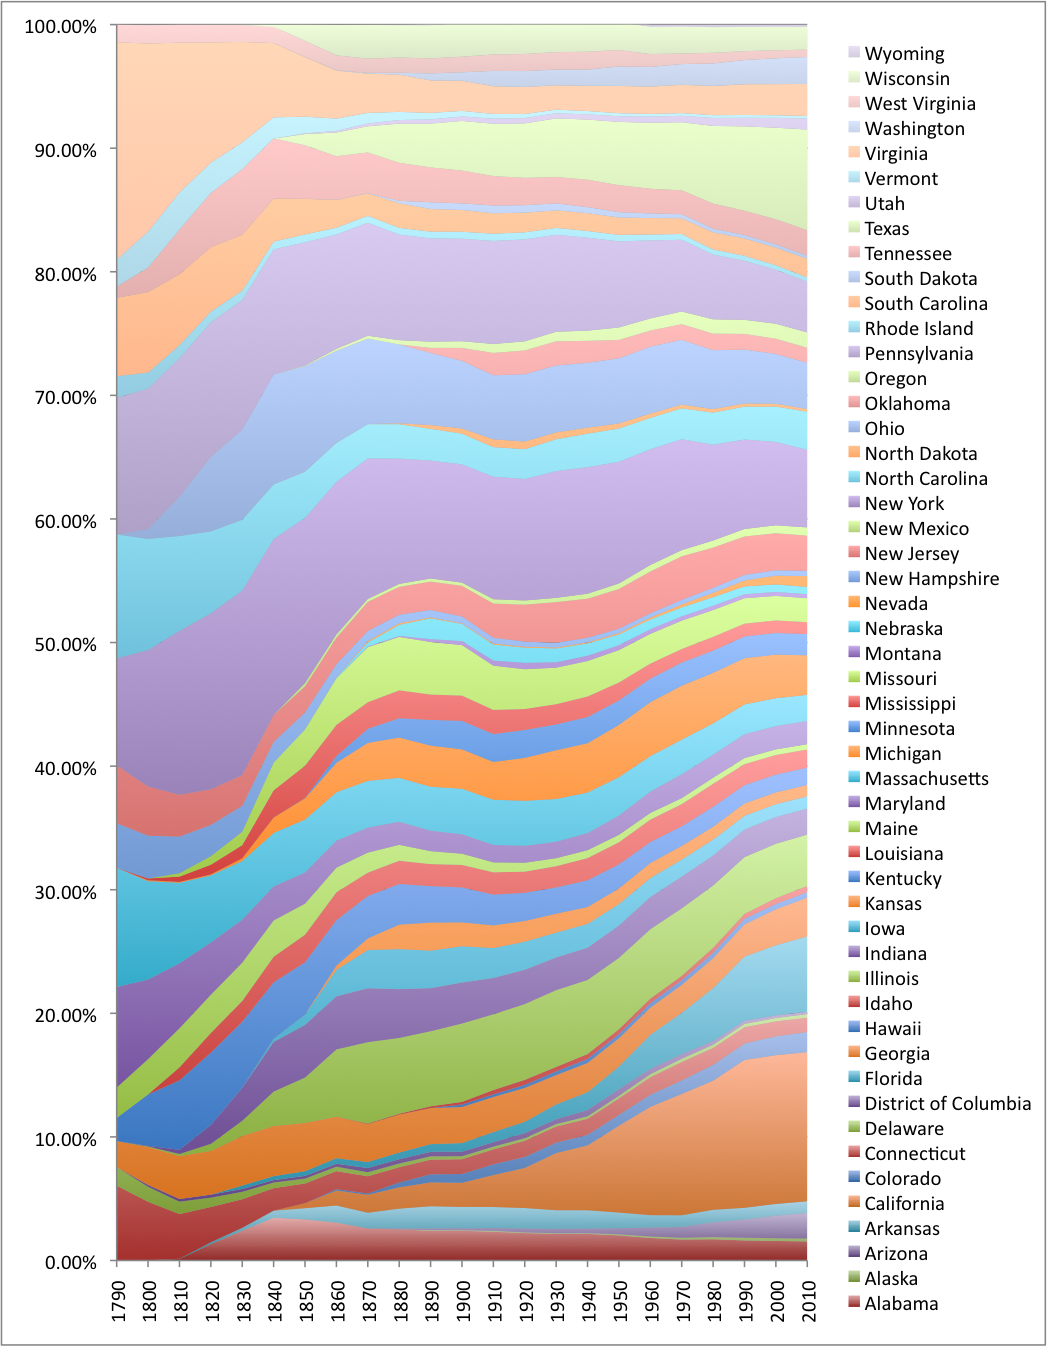
It turns out that Wikipedia actually has an article with data on the historical population of states, which I was able to turn into a plot of state populations as a function of national population over time. Some clarifications about the data:
- Data is shown for current state boundaries, even for time when the state was a territory or part of a different state. So pre-1820 data for Maine and Massachusetts are for the two regions separately, even though they were the same state at the time, for example.
- Data comes solely from the US Census, which means that population data is only shown starting at the date when a territory became part of the United States. Thus, for example, Hawaii's population jumps from 0 to 154,000 in 1900, not because of an actual population increase, but because the Kingdom of Hawai'i wasn't included in the US census, but the Territory of Hawaii was.
- As a related issue, the US census did not historically count all residents equally. I believe that this data does not include Native American population consistently or at all until around 1900. Looking at the census data that is given as a source, it appears that reservations don't get counted until 1900, and that "Indians not taxed" may generally have been excluded during most or all of the Eighteenth and Nineteenth Centuries.
Some observations that struck me as interesting:
- Virginia was originally huge. I'd always thought of it, Massachusetts, New York, and Pennsylvania as having been about equally "big states" at the time of the Revolution, but it seems that Virginia (including West Virginia and Kentucky) was 21% of the US population in 1790, while Massachusetts (including Maine) was 12%, Pennsylvania was 11%, and New York was only 8.5%. North Carolina (and Tennessee) was 11%, beating New York, while Maryland, unexpectedly, was next, and at 8.2%, seems to have rounded out the arguably "big" states.
- It's kind of impressive how steady New York's fraction has been, and Pennsylvania's was until the latter half of the Twentieth Century.
- It's also quite impressive how rapidly the Northwest Territory states' populations jumped to rival and exceed the populations of many of the original states in the first couple decades of the Eighteenth Century. They stopped being frontier fast. (It's also really impressive how fast cities like Chicago and Cleveland went from being barely-noticed trading posts to rich centers of industry.)
- While some of today's really-tiny states--Vermont, for example--can be blamed on areas that had substantial fractions of the population failing to keep up with the country's growth, others just really don't make any sense. Idaho, Montana, and the Dakotas have never had substantial fractions of the population, and in fact have never exceeded 0.5% to 0.6% of the population: if the average state size was to be close to this maximum, we'd need one hundred and eighty states!